

Data analytics goes beyond simple data collection and reporting. It provides a roadmap to understand, evaluate, and enhance business performance in real time. Using analytics software such as Google Analytics or advanced big data analytics tools, companies can gather insights from social media, customer interactions, sales data, and more. These insights are pivotal in tracking key performance indicators (KPIs) and business objectives.
Metrics that matter in today’s business world range from user engagement and conversion rates to cycle time in the supply chain. By analyzing both quantitative data and qualitative data, data analysts and data scientists can identify areas for performance improvements. This process of using data analytics to support metrics ultimately leads to data-driven decision-making, driving a business toward its strategic goals.
How Different Types of Data Analytics Support Business Metrics
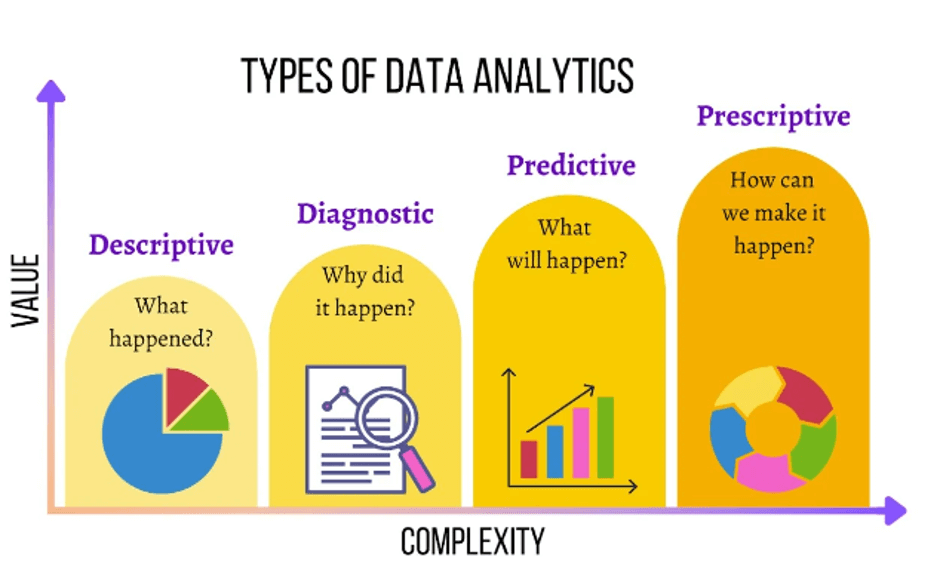
Data analytics is generally divided into four types: descriptive analytics, diagnostic analytics, predictive analytics, and prescriptive analytics. Each type plays a unique role in supporting various metrics:
- Descriptive Analytics: Provides a historical view by summarizing historical data and data points. For instance, data from past marketing campaigns helps companies understand what worked and what didn’t.
- Diagnostic Analytics: Identifies the root causes behind certain outcomes, helping teams understand customer behavior or why a particular key metric fell short.
- Predictive Analytics: Uses statistical models and machine learning to anticipate market trends, customer needs, and potential future issues, such as dips in customer lifetime value or sales revenue.
- Prescriptive Analytics: Recommends specific actions based on predictive analytics. For example, suggesting product development changes based on real-time customer feedback or adjusting resource allocation to optimize operational efficiency.
Each of these analytics types helps businesses support a diverse set of metrics that contribute to business goals and foster a competitive edge.
Key Metrics Supported by Data Analytics
Data analytics can support a range of specific metrics across departments. Here are some key areas:
1. Customer Satisfaction and Experience Metrics
- Net Promoter Score (NPS): NPS is a widely-used metric to gauge customer satisfaction. By analyzing customer data and feedback, data analysts can find patterns that drive NPS up or down, allowing the business to make adjustments.
- Customer Lifetime Value (CLV): CLV reflects the total value a customer brings to the business over time. By analyzing past customer interactions, companies can develop strategies to increase this metric.
- Conversion Rates: Analytics provide insights into which marketing strategies yield the highest conversion rates, allowing marketing teams to focus on the best-performing tactics.
2. User Engagement and Behavior Metrics
- Click-Through Rate (CTR): CTR measures the effectiveness of digital marketing efforts. With data analytics, teams can see what types of content drive more clicks, helping refine digital marketing strategies.
- Active Users and New Users: Tracking both active users and new users is essential for product managers. By examining user journey data, teams can identify friction points and optimize for better user engagement.
- User Behavior: Detailed analysis of user behavior reveals how people interact with your product or service. This data supports improvements in user experience and ultimately increases customer acquisition costs efficiency.
3. Operational Efficiency and Process Metrics
- Cycle Time: Tracking cycle time in production or other business processes is key for quality control and improving business performance. Data analytics tools can identify bottlenecks and suggest ways to reduce cycle time.
- Supply Chain Metrics: Data analytics can offer real-time insights into the supply chain, helping companies anticipate and respond to potential disruptions.
- Resource Allocation: By analyzing past resource utilization data, businesses can allocate resources more efficiently, resulting in cost savings and better results.
4. Sales and Revenue Metrics
- Sales Revenue: Sales revenue is one of the most important metrics for any business. Data analytics tools provide insights into sales data across different segments, enabling teams to focus on high-performing markets.
- Customer Acquisition Cost (CAC): Data analytics helps identify the most cost-effective channels for customer acquisition, optimizing marketing budgets and reducing CAC.
- Product Analytics: Product-specific data helps product managers and development teams understand what aspects drive or hinder sales. A/B testing within product analytics further fine-tunes offerings for maximum appeal.
How Data Analytics Drives Data-Driven Decision-Making
Data-driven decision-making is the process of basing decisions on data analysis rather than intuition. Here’s how data analytics supports this practice:
- Collecting Accurate Data from Various Sources: Data analytics involves gathering reliable data from diverse sources such as social media, customer service records, supply chain databases, and sales data.
- Processing and Analyzing Data for Key Metrics: Data analytics tools such as Google Analytics provide valuable insights by summarizing complex data sets into visual reports and dashboards, making it easier to track KPIs and spot trends.
- Ensuring Data Quality and Data Integrity: The effectiveness of analytics relies on the data quality. High data integrity is essential to ensure that the insights drawn are accurate and actionable. Investing in data management practices to maintain reliable data ensures better business outcomes.
- Delivering Actionable Insights: Data analytics turns complex data into actionable insights. For instance, predictive analytics might reveal that a particular segment is at risk of churn. With this information, customer retention teams can create targeted campaigns to reduce churn.
Examples of Metrics Supported by Data Analytics
The power of data analytics shines through in its ability to support and enhance a wide range of business metrics, providing essential insights that drive strategic decision-making and help companies achieve their objectives. By analyzing data across customer retention, conversion, revenue growth, and operational efficiency, businesses can pinpoint areas for improvement and take targeted actions to drive performance.
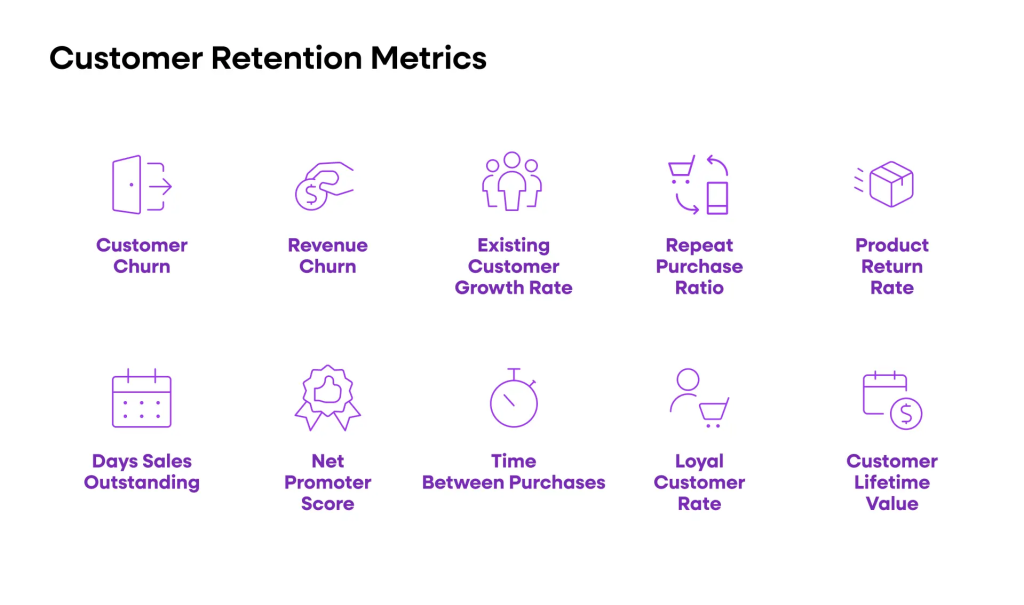
Customer Retention Metrics: Metrics such as Net Promoter Score (NPS) and Customer Lifetime Value (CLV) provide key insights into customer loyalty. NPS, a measure of customer satisfaction, helps businesses understand how likely customers are to recommend their brand, identifying areas where customer experience could be enhanced. CLV calculates the total value a customer brings over their lifetime, guiding retention efforts by spotlighting high-value customer segments and helping tailor strategies that increase loyalty and engagement.
Conversion Metrics: Conversion rates from different marketing campaigns are essential for optimizing audience targeting and improving marketing effectiveness. By tracking metrics like click-through rates (CTR) and cost per acquisition, data analytics allows marketing teams to identify which channels and messages resonate best, making it easier to allocate resources to high-performing tactics and refine strategies for greater impact.
Revenue Growth: Sales revenue growth, tracked across product lines or regions, reveals which areas contribute most to the company’s bottom line. Analytics helps highlight top-performing products and segments, guiding product development and marketing strategies that can enhance profitability and drive sustained growth.
Operational Efficiency: Efficiency metrics such as cycle time measure the speed of business processes, pinpointing bottlenecks that may hinder productivity. By analyzing operational data, teams can implement process improvements that streamline workflows, reduce costs, and increase overall efficiency, ultimately enhancing both customer satisfaction and profitability.
Best Practices for Effective Data Analytics
Effective data analytics goes beyond mere data collection; it requires a thoughtful, structured approach to maximize insights and ensure that analytics efforts drive meaningful outcomes. Implementing best practices can help organizations harness the full potential of their data analytics initiatives.
Define Clear Objectives and KPIs: Setting specific objectives and key performance indicators (KPIs) that align with broader business goals ensures that analytics efforts remain focused. These defined KPIs create a roadmap for measuring progress and success, helping teams prioritize metrics that directly contribute to strategic outcomes. Clear objectives also streamline the data analytics process, keeping teams aligned and resource allocation optimized.
Invest in Quality Data Collection: Reliable data is the foundation of actionable insights. Gathering data from trustworthy, relevant sources ensures accuracy, helping avoid the risks associated with poor data quality, such as misguided strategies or lost revenue. Effective data management practices, including data validation and regular quality checks, are essential to maintaining high data standards.
Utilize Advanced Analytics Tools: Advanced data analytics tools—especially those with machine learning and artificial intelligence capabilities—enable businesses to analyze large volumes of data with greater precision. Tools that automate data processing, identify patterns, and generate predictive insights can provide teams with a deeper understanding of customer behavior, operational efficiency, and market trends.
Encourage Cross-Functional Collaboration: Collaboration among departments like marketing, product development, and customer service is essential for translating data insights into actionable strategies. By sharing insights across teams, organizations ensure that each function leverages data analytics to drive improvements, from refining customer experience to optimizing product features, leading to better results and a stronger, more cohesive strategy.
Data Science, Machine Learning, and Statistical Analysis in Data Analytics
Data science and machine learning are transformative elements within data analytics. By using machine learning algorithms, businesses can automate the analysis of vast data sets and predict future trends. Additionally, statistical analysis techniques allow businesses to validate data and draw insights with high precision.
Statistical models are used to create predictive analytics solutions, which are particularly useful for understanding customer behavior, market trends, and business performance. For instance, using statistical models, businesses can accurately forecast sales revenue or identify the most effective marketing strategies for improving click-through rates.
Building a Data Team for Business Success
A robust data team is fundamental to successfully leveraging data analytics, turning complex data sets into valuable insights that drive business decisions. This team typically consists of data analysts, data scientists, and data engineers, each bringing specialized skills to the table. Data analysts focus on exploring and interpreting data, identifying trends and patterns that can inform business strategies. Data scientists, with their expertise in machine learning and statistical modeling, develop predictive models that forecast future trends or customer behavior. Meanwhile, data engineers ensure the infrastructure and data pipelines are in place, enabling smooth data flow and reliable access to accurate data.
Effective analytics requires more than just technical skills; collaboration across teams is equally important. Product managers, marketing teams, and customer service teams play a critical role in shaping how these insights are applied. Product managers can use customer behavior data to refine features or plan new offerings, while marketing teams can tailor campaigns based on engagement and conversion metrics. Customer service teams can leverage insights into common pain points to enhance the customer experience. Together, this cross-functional collaboration ensures that insights are not only uncovered but also strategically integrated to drive tangible improvements across the organization.
Conclusion
Data analytics is integral to supporting the metrics that drive business success. From customer satisfaction and conversion rates to operational efficiency and sales revenue, analytics transforms raw data into valuable insights that enable companies to achieve their strategic goals and remain competitive. Leveraging tools and practices across data science, machine learning, and statistical analysis, companies can ensure that they are not only meeting business objectives but also exceeding them.