

Predicting how consumers adopt new products is crucial for businesses, marketers, and innovators alike. The Bass Diffusion Model, introduced by Frank Bass in 1969, provides a mathematical framework to forecast the adoption of new products or technologies over time. With its ability to predict adoption curves, this model has become a vital tool for strategic decision-making in various industries.
In this article, we’ll explore the Bass Diffusion Model in detail, discussing its components, applications, and how it can help businesses better understand consumer behavior and plan for market success.
What is the Bass Diffusion Model?
The Bass Diffusion Model is a mathematical model that describes the process by which new products and innovations are adopted by a population. The model categorizes adopters into two groups:
- Innovators: Individuals who are influenced by external factors such as advertising and early market communication.
- Imitators: Individuals who adopt the product after being influenced by others, often through word-of-mouth or social proof.
The model explains how these two groups interact to drive the adoption of a product, typically resulting in an S-shaped adoption curve that represents the growth and eventual saturation of the market.
Key Components of the Bass Diffusion Model
The Bass Diffusion Model is driven by two critical parameters:
- Coefficient of Innovation (p): This represents the probability of adoption driven by external factors, such as advertising or promotional efforts. Innovators are represented by this coefficient.
- Coefficient of Imitation (q): This represents the probability of adoption driven by social influence, such as recommendations and observed usage. Imitators are represented by this coefficient.
The adoption rate at any given time is mathematically represented as:
f(t) = [p + q \cdot F(t)] \cdot [1 – F(t)]
Where:
- f(t) is the probability of adoption at time ttt.
- F(t) is the cumulative probability of adoption by time ttt.
This equation provides a framework to predict how a product’s adoption progresses over time.
Visualization of the Adoption Curve
The adoption curve predicted by the Bass Diffusion Model is a classic S-shaped curve that illustrates how a product gains traction in a market over time. Below, the graph showcases adoption patterns under three different scenarios:
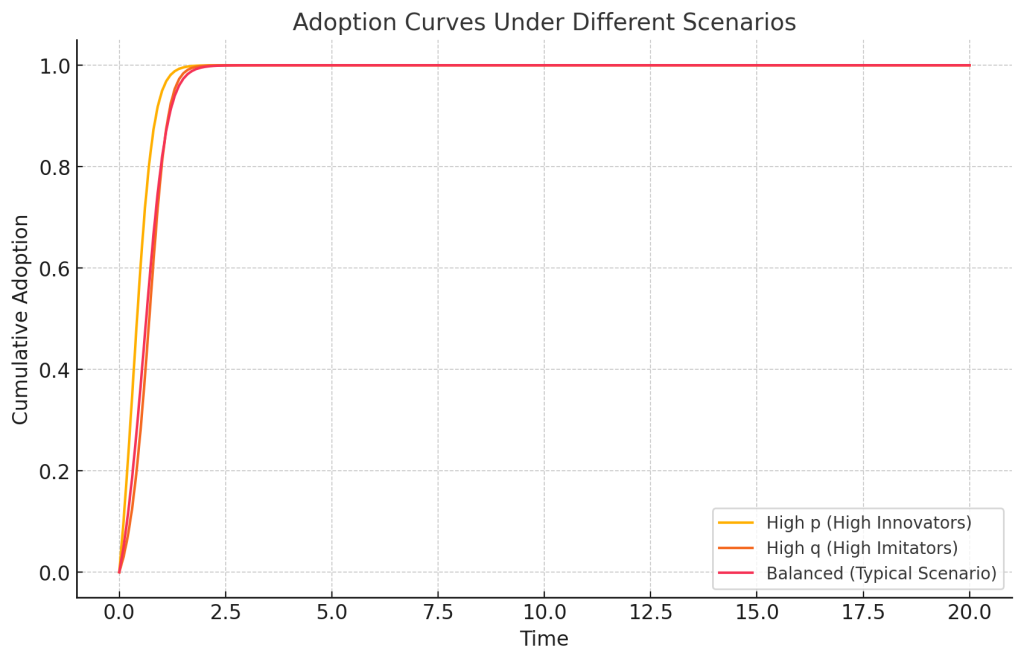
- p (High Innovators): This curve rises quickly in the early stages due to a higher proportion of innovators adopting the product. Innovators are less risk-averse and more likely to try a new product early on, leading to a rapid initial uptake. However, the growth rate slows as the market saturates.
- High qqq (High Imitators): In this scenario, adoption accelerates significantly during the growth phase as imitators, influenced by social proof and recommendations, begin to adopt the product. The steep curve during the middle phase reflects the strong influence of word-of-mouth and observed usage.
- Balanced (Typical Scenario): This curve represents a balanced mix of innovators and imitators. Adoption grows steadily, with neither group dominating, leading to a moderate growth phase followed by market saturation.
Interpreting the Graph
- Introduction Phase: For all scenarios, adoption begins slowly as innovators adopt the product. The steepness of the curve during this phase is determined by the coefficient of innovation (ppp).
- Growth Phase: The growth phase shows a sharper increase in adoption, particularly in the high qqq scenario, where imitators drive rapid adoption.
- Maturity Phase: Adoption eventually slows down as the market reaches saturation, visible in all scenarios.
Business Implications
This visualization provides valuable insights for businesses:
- Product Launch Strategies: Products with high ppp values may benefit from aggressive early-stage marketing to capitalize on innovators’ willingness to adopt.
- Leveraging Social Influence: For products with high qqq, focusing on creating positive word-of-mouth and leveraging social proof can significantly accelerate adoption.
- Forecasting Sales: By estimating ppp and qqq, businesses can anticipate the pace and timing of adoption, enabling better resource allocation and production planning.
- Identifying Market Saturation: Understanding when the maturity phase begins can guide decisions on introducing new features or launching related products to maintain growth.
This graph serves as a practical demonstration of the Bass Diffusion Model, emphasizing how innovators and imitators interact to shape a product’s lifecycle. By tailoring strategies based on the adoption curve, businesses can maximize market penetration and long-term success.
Innovators vs. Imitators: Driving Adoption
The distinction between innovators and imitators is at the heart of the Bass Diffusion Model.
Innovators are typically early adopters who are less risk-averse and more receptive to trying new technologies or products. They are influenced by external factors like marketing, promotional offers, and media coverage.
Imitators follow innovators and base their decision to adopt a product on the experiences and recommendations of others. They are influenced by social proof, word-of-mouth, and observed behavior.
This interplay between innovators and imitators drives the adoption curve, starting with a slow uptake and accelerating as imitators join the market.
How to Estimate Model Parameters
Accurate estimation of the parameters p (coefficient of innovation) and q (coefficient of imitation) is critical for the predictive accuracy of the Bass Diffusion Model. Here are some effective methods to estimate these parameters:
- Historical Sales Data:
Analyze historical adoption or sales data to fit the model. Use statistical techniques like regression analysis to determine the values of p and q that best explain past trends. - Market Research and Surveys:
Conduct consumer surveys, focus groups, or interviews to gather insights about early adopters and the likelihood of word-of-mouth influence. This helps in understanding factors affecting ppp and q. - Comparison with Similar Products:
Use data from similar products or technologies that have already been adopted in the market to estimate parameters. This method works well for products targeting the same demographic or industry. - Software Tools:
Leverage tools like Python, R, or Excel to apply non-linear regression techniques that fit the Bass Diffusion Model to your dataset. These tools simplify parameter estimation by automating complex calculations. - Expert Judgments:
Consult industry experts to estimate p and q based on their experience with similar products or market conditions. While less precise, this method provides a good starting point for further refinement.
Accurately estimating these parameters ensures the model aligns with real-world scenarios, improving its reliability for forecasting adoption curves and guiding strategic decisions.
Benefits of the Bass Diffusion Model
The Bass Diffusion Model offers several advantages:
- Predictive Accuracy: Provides a reliable forecast of product adoption over time.
- Strategic Insights: Helps businesses make informed decisions about marketing, production, and resource allocation.
- Adaptability: Can be applied across industries and product categories.
- Simplicity: Offers a straightforward framework for understanding complex adoption dynamics.
Limitations of the Bass Diffusion Model
Despite its strengths, the Bass Diffusion Model has limitations:
- Static Parameters: The model assumes that ppp and qqq remain constant, which may not reflect real-world market dynamics.
- Exclusion of External Variables: Factors such as competition, economic changes, and technological advancements are not directly incorporated into the model.
- Simplified Adoption Dynamics: The model assumes a homogenous population, which may not capture diverse consumer behaviors.
Conclusion
The Bass Diffusion Model remains a powerful tool for understanding and predicting product adoption. By identifying the interplay between innovators and imitators, businesses can anticipate market behavior, optimize marketing efforts, and enhance decision-making. While the model has limitations, its simplicity and adaptability make it invaluable for strategizing product launches, forecasting sales, and understanding consumer behavior.