

Decision trees are a fundamental concept in machine learning, offering a versatile approach to both classification and regression tasks. Let’s delve into what decision trees entail and why they hold significance in the realm of data analysis and predictive modeling.
Definition of Decision Tree Model
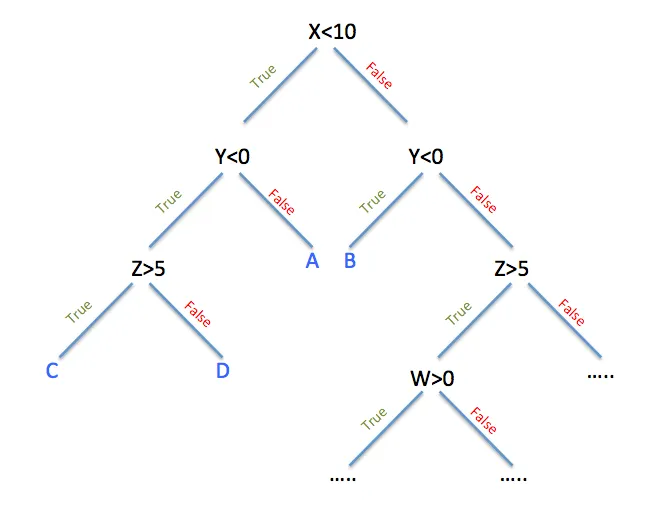
At its core, a decision tree model represents a flowchart-like structure where each internal node denotes a test on an attribute, each branch represents the outcome of the test, and each leaf node corresponds to a class label or a numerical value. Essentially, decision trees partition the feature space into regions based on the values of input features, enabling intuitive interpretation and providing actionable insights.
The decision tree algorithm operates by recursively partitioning the feature space into smaller subsets, aiming to maximize the homogeneity of the target variable within each subset. This process involves selecting the best attribute to split the data at each node, typically based on criteria such as Gini impurity or information gain. The algorithm continues splitting until a stopping criterion is met, such as reaching a maximum depth or minimum number of samples per leaf.
Importance of Decision Tree Analysis in Machine Learning
Decision tree analysis holds paramount importance in machine learning for several reasons:
- Interpretability: Decision trees offer a transparent and interpretable model, allowing stakeholders to understand and trust the decision-making process.
- Versatility: Decision trees can handle both categorical and numerical data, making them suitable for a wide range of applications.
- Feature Importance: Decision trees provide insights into feature importance, aiding in feature selection and understanding the underlying data dynamics.
- Foundation for Ensemble Methods: Decision trees serve as building blocks for ensemble methods like random forests, which combine multiple trees to enhance predictive performance.
- Scalability: Decision trees are computationally efficient and can handle large datasets with ease.
Decision trees serve as a cornerstone in machine learning and they offer an intuitive and powerful tool for data analysis, prediction, and interpretation. Their simplicity, interpretability, and effectiveness make them a popular choice across various domains, from healthcare to finance to marketing.
Components of a Decision Tree
A decision tree comprises several essential components that collectively contribute to its structure and functionality.
A. Root Node:
- The root node represents the starting point of the decision tree.
- It contains the entire dataset and serves as the initial split based on the attribute that maximizes information gain or reduces impurity.
B. Decision Node:
- Decision nodes are internal nodes in the tree.
- They represent points where decisions are made based on the values of specific features.
- Each decision node leads to one or more child nodes based on the outcome of the decision.
C. Leaf Node:
- Leaf nodes, also known as terminal nodes, are the endpoints of the decision tree.
- They represent the final outcomes or predictions of the model.
- Leaf nodes contain the class label (for classification trees) or the predicted value (for regression trees).
D. Internal Nodes:
- Internal nodes are decision nodes located between the root node and the leaf nodes.
- They contribute to the process of recursively splitting the dataset based on different attributes.
E. Terminal Node:
- Terminal nodes are synonymous with leaf nodes.
- They denote the end points of the decision tree where no further splitting occurs.
F. Tree Structure:
- The tree structure refers to the hierarchical arrangement of nodes in the decision tree.
- It visually depicts the sequence of decisions made to arrive at the final predictions.
G. Child Nodes:
- Child nodes are the nodes directly connected to a parent node.
- They represent the subsets of data resulting from splitting at the parent node.
H. Decision Point:
- Decision points occur at decision nodes where the data is partitioned based on the value of a specific feature.
- They determine the subsequent path in the decision tree.
I. Chance Nodes:
- Chance nodes represent uncertain outcomes or events in decision tree analysis.
- They are typically encountered in decision trees used for decision analysis under uncertainty.
Understanding the components of a decision tree is essential for interpreting the decision-making process and the resulting predictions. Each component plays a distinct role in shaping the structure and behavior of the tree, ultimately influencing its predictive performance in various scenarios.
Decision Tree Construction
Constructing a decision tree involves several key steps and considerations, each aimed at creating an effective and interpretable model.
A. Splitting Criteria:
- Gini Index:
- The Gini index measures the impurity of a node in a decision tree.
- It quantifies the likelihood of incorrect classification if a random sample from the node is incorrectly labeled.
- Entropy Value:
- Entropy is another measure of impurity used in decision tree construction.
- It calculates the uncertainty or disorder of a node, with lower entropy indicating higher purity.
B. Attribute Selection Measure:
- The attribute selection measure determines the best split for each node in the decision tree.
- Common measures include Gini impurity and information gain (based on entropy).
C. Best Split:
- The best split is determined by selecting the attribute and corresponding threshold that maximizes the purity or information gain of the resulting child nodes.
D. Maximum Depth of the Tree:
- The maximum depth of the tree specifies the maximum number of levels or splits allowed.
- Limiting the depth helps prevent overfitting and improves the generalization ability of the model.
E. Minimum Number of Samples:
- The minimum number of samples specifies the minimum number of data points required to create a split at a node.
- Nodes with fewer samples than the specified threshold are not split further, helping to avoid overly complex trees.
F. Stopping Criterion:
- The stopping criterion determines when to stop splitting nodes and designate them as leaf nodes.
- Common stopping criteria include reaching the maximum depth, having fewer samples than the minimum threshold, or achieving a certain level of purity.
G. Iterative Process:
- Building a decision tree is an iterative process that involves recursively partitioning the dataset based on the selected attributes until the stopping criteria are met.
- At each step, the algorithm identifies the best split and continues to split the dataset into smaller subsets until reaching the terminal nodes.
Constructing a decision tree requires careful consideration of these factors to ensure the resulting model effectively captures the underlying patterns in the data while avoiding overfitting. By iteratively selecting optimal splits and stopping criteria, decision trees can provide interpretable and accurate predictions across various classification and regression tasks.
Interpretation of Decision Tree Results
Interpreting the results of decision trees is an important process to understand the underlying patterns in the data and derive actionable insights. This section explores the interpretation of decision tree results, focusing on both classification and regression trees.
A. Classification Trees:
- Class Labels:
- Classification trees assign class labels to instances based on the majority class within the leaf node.
- Each leaf node represents a class label that the decision tree assigns to the corresponding data points.
- Potential Outcomes:
- Decision trees classify new instances by traversing the tree from the root node to a leaf node based on the values of the input features.
- The outcome or predicted class label is determined by the leaf node reached during traversal.
- Best Attribute:
- The decision tree identifies the best attribute for splitting the data at each node to maximize information gain or purity.
- Attributes with the highest information gain or lowest impurity contribute most to the classification process.
- Important Features:
- Decision trees highlight important features that significantly contribute to the classification process.
- Features with higher levels of information gain or importance play a crucial role in distinguishing between different classes.
- Feature Importance:
- Feature importance quantifies the contribution of each feature to the overall performance of the decision tree.
- It helps prioritize features and provides insights into which attributes are most relevant for classification.
B. Regression Trees:
- Continuous Values:
- Regression trees predict continuous values as opposed to discrete class labels in classification trees.
- They are suitable for regression problems where the target variable is numeric and exhibits a linear or nonlinear relationship with the input features.
- Regression Problems:
- Regression trees address regression problems by recursively partitioning the feature space and predicting the target variable within each partition.
- They can handle scenarios where the relationship between the independent and dependent variables is not linear.
- Linear Relationship:
- While regression trees can capture nonlinear relationships between variables, they can also model linear relationships effectively, depending on the data and tree structure.
- Predicted Value of the Target Variable:
- The predicted value of the target variable is obtained by traversing the tree from the root node to a leaf node and aggregating the values within the leaf.
C. Decision Tree Diagram:
- Visualization of Tree Structure:
- Decision tree diagrams visually represent the hierarchical structure of the tree, including nodes, branches, and leaf nodes.
- They provide a comprehensive overview of the decision-making process and how features contribute to classification or regression.
- Decision Path:
- The decision path illustrates the sequence of decisions made at each node to arrive at a specific outcome or predicted value.
- It helps understand the logic behind the model’s predictions and identify key decision points.
- Different Branches:
- Decision tree diagrams depict different branches corresponding to the possible paths from the root node to the leaf nodes.
- Each branch represents a distinct decision-making process based on the values of the input features.
Interpreting decision tree results involves analyzing the classification or regression process, understanding the importance of features, and visualizing the tree structure to gain insights into the underlying data patterns. This interpretation guides decision-making and informs further analysis and model improvement efforts.
Practical Application and Examples
Decision trees find extensive practical applications across various domains, from classification tasks to regression analyses. This section explores the implementation of decision trees using Scikit-learn, interpretation with the famous iris dataset, and real-world case studies covering both classification and regression tasks.
Scikit-learn Implementation
Scikit-learn, a popular machine learning library in Python, provides efficient tools for implementing decision trees. Its decision tree module offers functionalities for training, visualizing, and interpreting decision tree models.
# Example 1: Classification Task

# Importing necessary libraries
from sklearn.datasets import load_iris
from sklearn.tree import DecisionTreeClassifier, plot_tree
import matplotlib.pyplot as plt

# Loading the iris dataset
iris = load_iris()
X = iris.data
y = iris.target

# Creating and training the decision tree classifier
clf = DecisionTreeClassifier()
clf.fit(X, y)

# Visualizing the decision tree
plt.figure(figsize=(12, 8))
plot_tree(clf, filled=True, feature_names=iris.feature_names, class_names=iris.target_names)
plt.show()

# Interpretation
# The decision tree provides insights into how the classifier makes decisions based on the features of the iris dataset.
# Each node represents a decision point, with branches indicating possible outcomes.
# Features such as petal length and width play a crucial role in distinguishing between different iris species.
# Example 2: Regression Task
# Importing necessary libraries
from sklearn.datasets import load_boston
from sklearn.tree import DecisionTreeRegressor, plot_tree
import matplotlib.pyplot as plt
# Loading the Boston housing dataset
boston = load_boston()
X = boston.data
y = boston.target
# Creating and training the decision tree regressor
reg = DecisionTreeRegressor()
reg.fit(X, y)
# Visualizing the decision tree
plt.figure(figsize=(12, 8))
plot_tree(reg, filled=True, feature_names=boston.feature_names)
plt.show()
# Interpretation
# The decision tree reveals the hierarchical structure of the regression model, with each node representing a decision point.
# Features such as RM (average number of rooms per dwelling) and LSTAT (percentage of lower status of the population) are important predictors of housing prices.Case Studies: Classification and Regression Tasks
- Iris Setosa Classification:
- In a classification task using the iris dataset, decision trees can accurately classify iris species, including the distinct Iris Setosa, based on petal and sepal measurements.
- Decision tree models can provide insights into the distinguishing features of each species and their importance in classification.
- Blood Glucose Levels Prediction:
- In a regression task, decision trees can predict blood glucose levels based on relevant physiological variables.
- By analyzing the decision path, healthcare professionals can gain insights into the factors influencing blood glucose levels and inform treatment strategies.
- Linear Regression Example:
- Decision trees can also perform regression tasks, including linear regression, by partitioning the feature space and predicting continuous target variables.
- While decision trees excel in capturing nonlinear relationships, they can also model linear relationships effectively, depending on the dataset and tree structure.
Decision Tree Best Practices
Below are key practices to follow for successful decision tree analysis:
A. Importance of Domain Knowledge:
- Domain knowledge plays a critical role in decision tree analysis as it helps in selecting relevant features, interpreting results, and understanding the implications of the model’s decisions within a specific context.
B. Understanding Feature Values and Importance:
- Thorough understanding of feature values and their importance aids in selecting the best features for splitting nodes, ensuring the decision tree captures the underlying patterns in the data accurately.
C. Handling Missing Data:
- Addressing missing data appropriately is crucial to prevent bias and ensure the robustness of the decision tree model. Techniques such as imputation or dropping missing values should be employed based on the dataset and context.
D. Test Sets and Sample Size Considerations:
- Proper allocation of data into training and test sets is essential for evaluating model performance. Additionally, consideration of sample size ensures that the decision tree model is trained on a representative dataset that captures the variability present in the population.
E. Following Best Practices in Decision Tree Analysis:
- Adhering to best practices such as pruning to prevent overfitting, setting appropriate stopping criteria, and selecting the optimal tree depth helps in building interpretable and generalizable decision tree models.
Conclusion
Decision trees stand as versatile and interpretable tools in the realm of data analytics and machine learning. Their ability to navigate complex decision paths while maintaining transparency makes them invaluable assets across diverse domains. By following best practices, understanding feature importance, and leveraging domain knowledge, decision trees empower practitioners to extract meaningful insights, make accurate predictions, and drive informed decision-making processes.